Winning Formula
Rentokil Initial is a globally renowned provider of essential services, specialising in pest control, hygiene, and environmental services. Founded in 1927, the company has a rich history of delivering innovative solutions to businesses and households around the world.
Role: UX/UI Designer
Timeline: 9 months
Company: Rentokil Initial
Tools: Figma, Miro, Jira
Impact: The redesigned platform led to an increase in business revenue by 12% in first quarter of pilot launch
My role
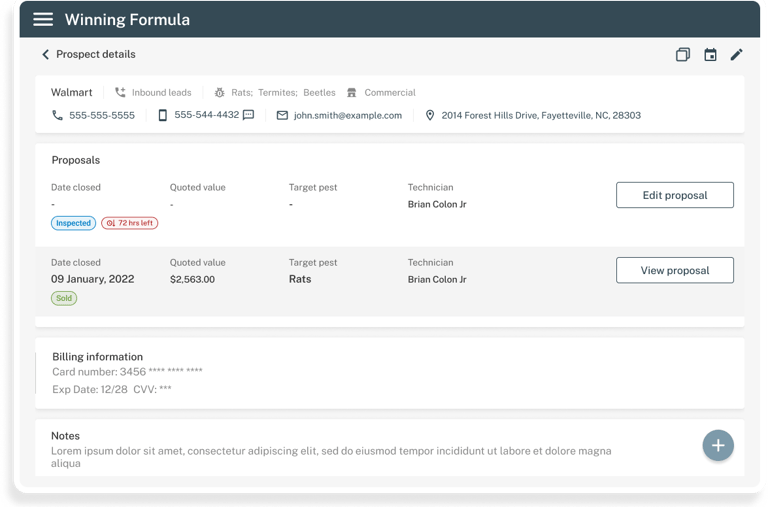
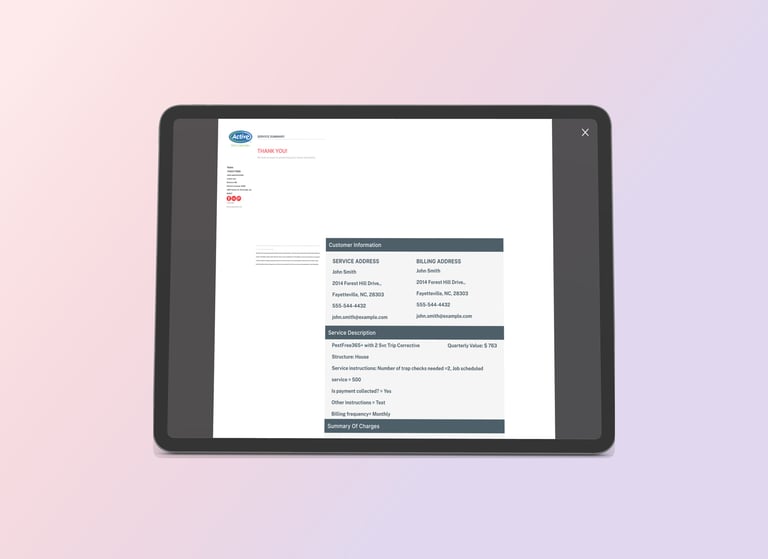
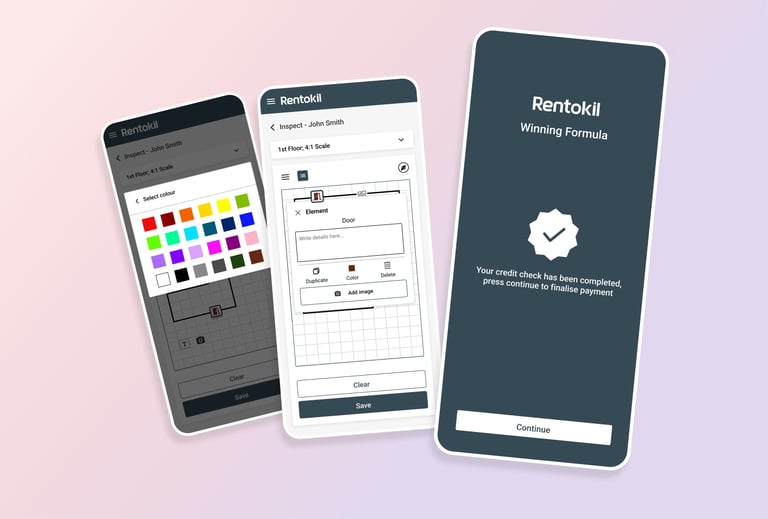
As the lead designer overseeing the redesign and ongoing maintenance of the Winning Formula application, I played a pivotal role in optimising the user experience for Pest Control Consultants (PCCs). This graphing and inspection app revolutionises the way PCCs inspect customer properties and offer tailored pest control solutions, providing a seamless and data-driven approach to pest management.
Background
The problem
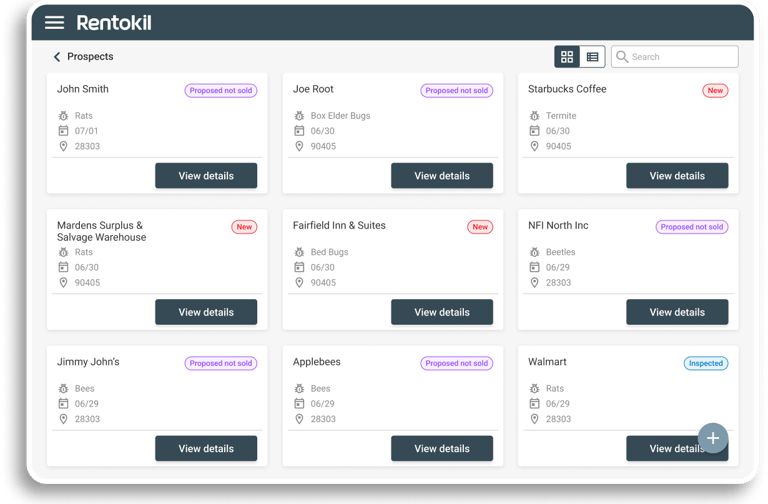
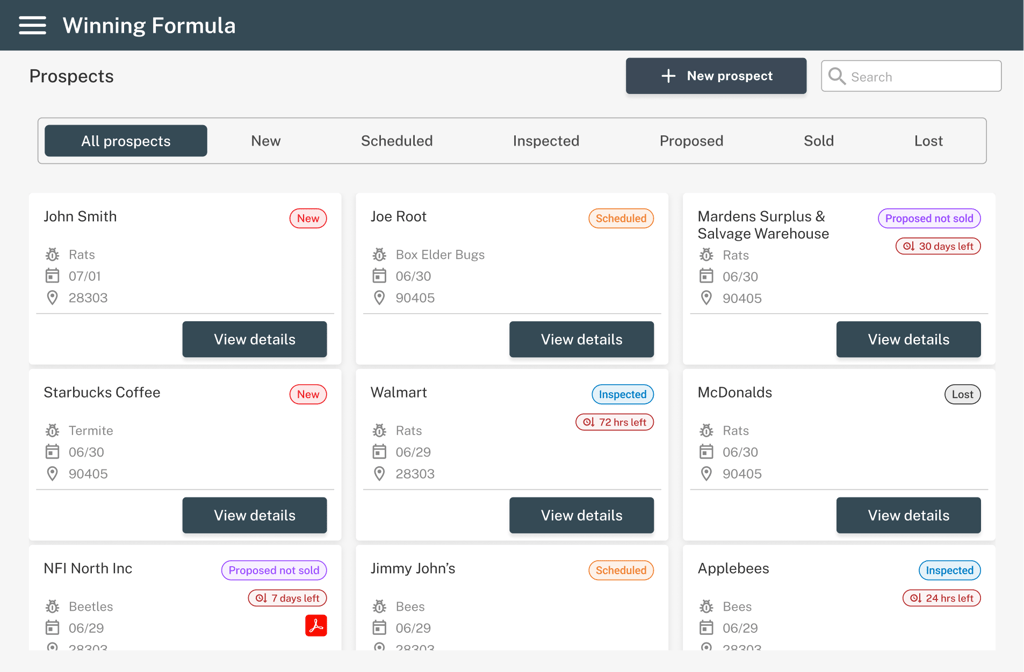
Winning Formula is an internal platform used by pest control officers to conduct investigations at client properties.
The project focused on improving the investigation workflow and aligning the system with real-world inspection processes.
Manual input and records
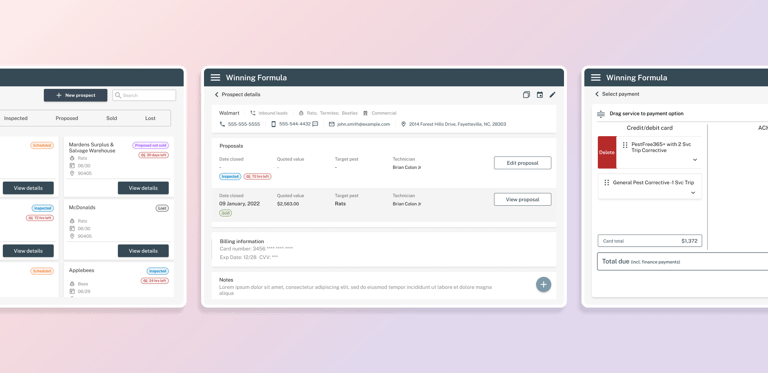
The existing system required officers to move between multiple applications and input investigation records manually, while conducting inspections. This slowed the investigation process and increased the risk of incomplete or incorrect records. We approached this by combining all required functionality into one system while improving reporting process.
Complex data visualisation
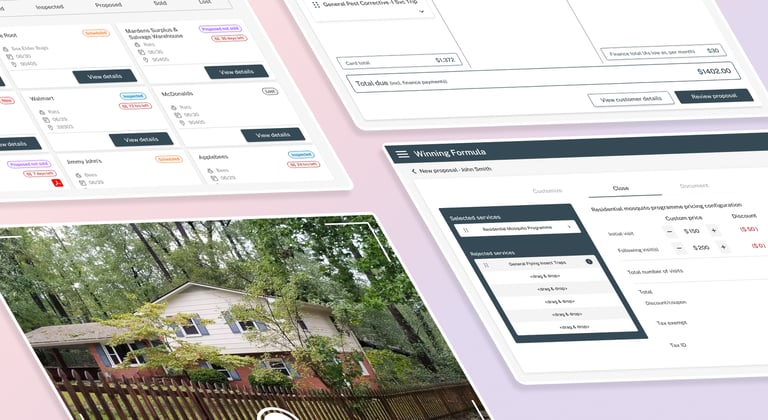
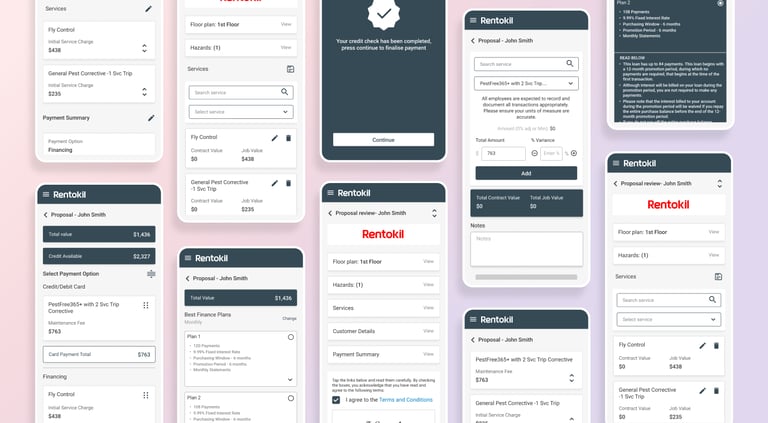
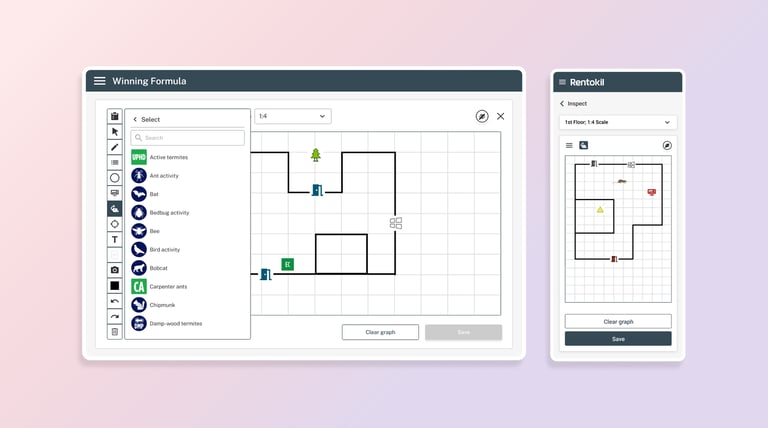
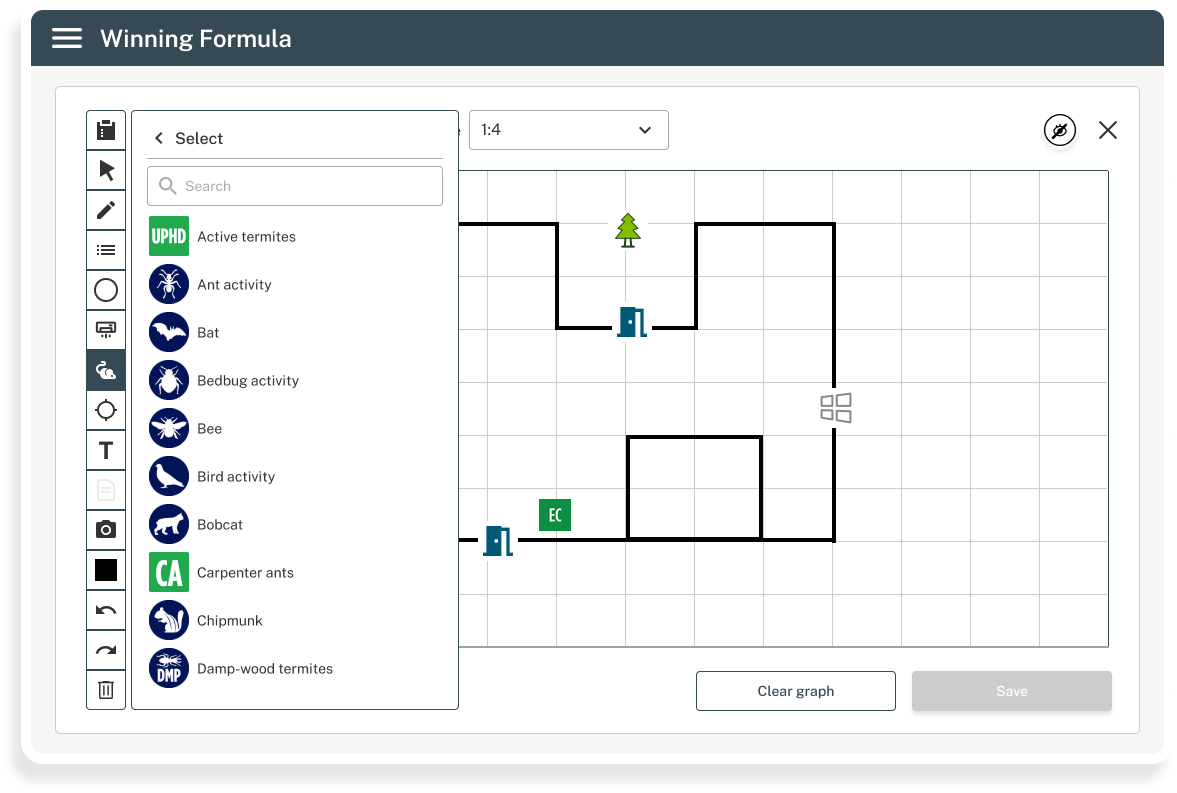
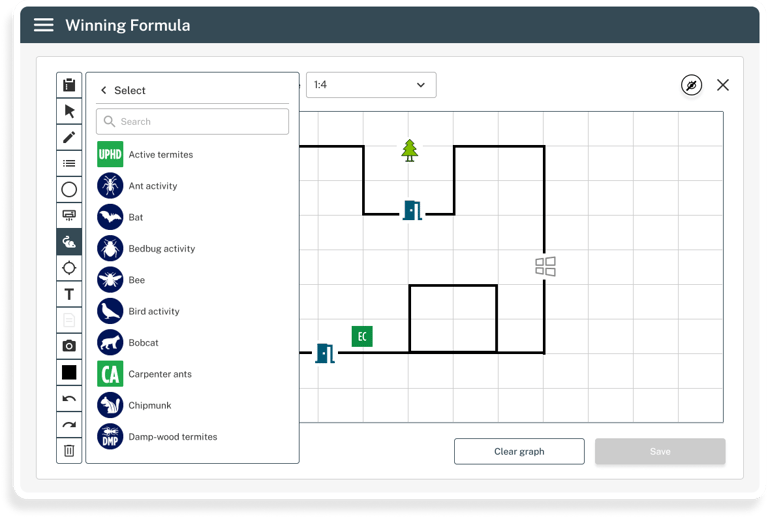
Designing a user-friendly interface for complex data visualisation was a challenge. I addressed this by implementing interactive graphing tools with zoom and filter capabilities, simplifying data interpretation for PCCs.
Improved user interface
The existing user interface (UI) lacked user-friendliness and consistency, leading to user frustration and inefficiencies. Conducted user research to understand pain points and preferences.
I revamped the UI with a focus on intuitive navigation, clear layouts, and a visually appealing design, resulting in a more user-friendly experience. Regularly conducted usability testing with users to gather feedback and identify areas for improvement.
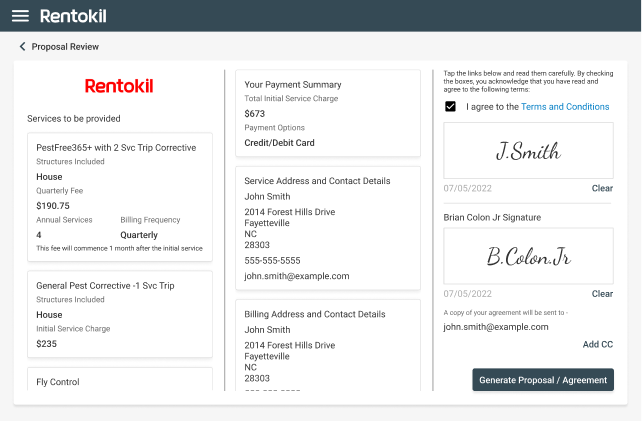
Harmonised product and pricing
Managing diverse pricing structures and service offerings across regions and product lines posed challenges in providing a consistent and transparent experience for customers.
So we developed a standardized pricing model that could accommodate various service variations. Streamlined the product catalog by identifying redundant or obsolete services. This simplification made it easier for customers to understand and select the right services, reducing complexity.
Success metrics
These are the success metrics and criteria set for the project to make sure all ares were considered
User goals
Business goals
Constraints
Improve accuracy of investigations
Improve quality of inspection data
Reduce customer complaints
Faster inspections
Easier data entry in the field
A centralised data keeping system
Field environments with inconsistent connectivity
Complex operational workflows
Research & discovery
Interviews and surveys with pest management officers indicated that the digital processes did not align with how inspections were actually carried out in real settings. This led to a few pain points for them as inspectors and their customers
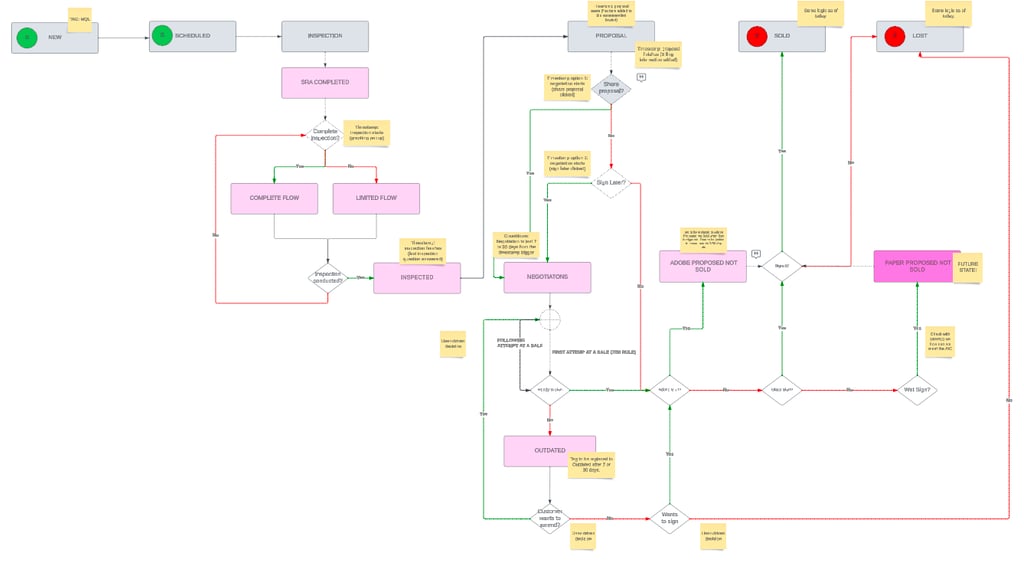
Workflow redesign
The system was redesigned to mirror the physical inspection process used by officers, ensuring that every detail is meticulously evaluated and that the protocol is adhered to with the highest level of accuracy. This enhancement not only streamlines the workflow but also increases efficiency and accountability among the officers involved in the process, thereby improving overall operational effectiveness.
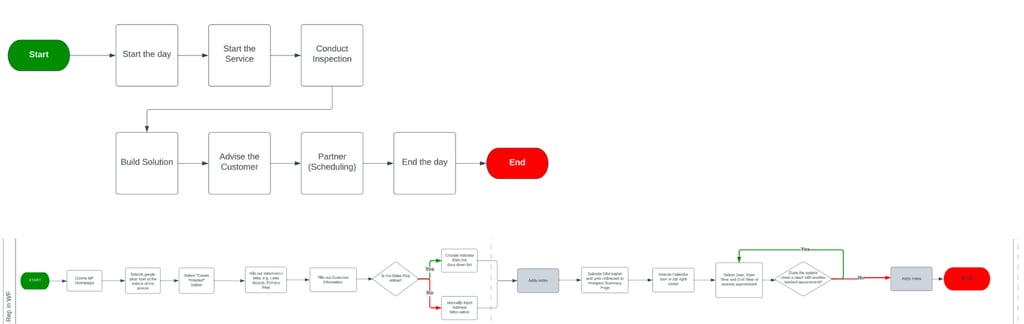
Before
After
Concept exploration
Different interface patterns were explored to determine the most efficient workflow. This effort involved analyzing various designs to identify the best practices and optimal user interactions that could enhance productivity and create a smoother experience for the end-users. Teams conducted user testing sessions, gathered feedback, and iterated on the designs to ensure that all functional requirements were met effectively.
Initial wireframes
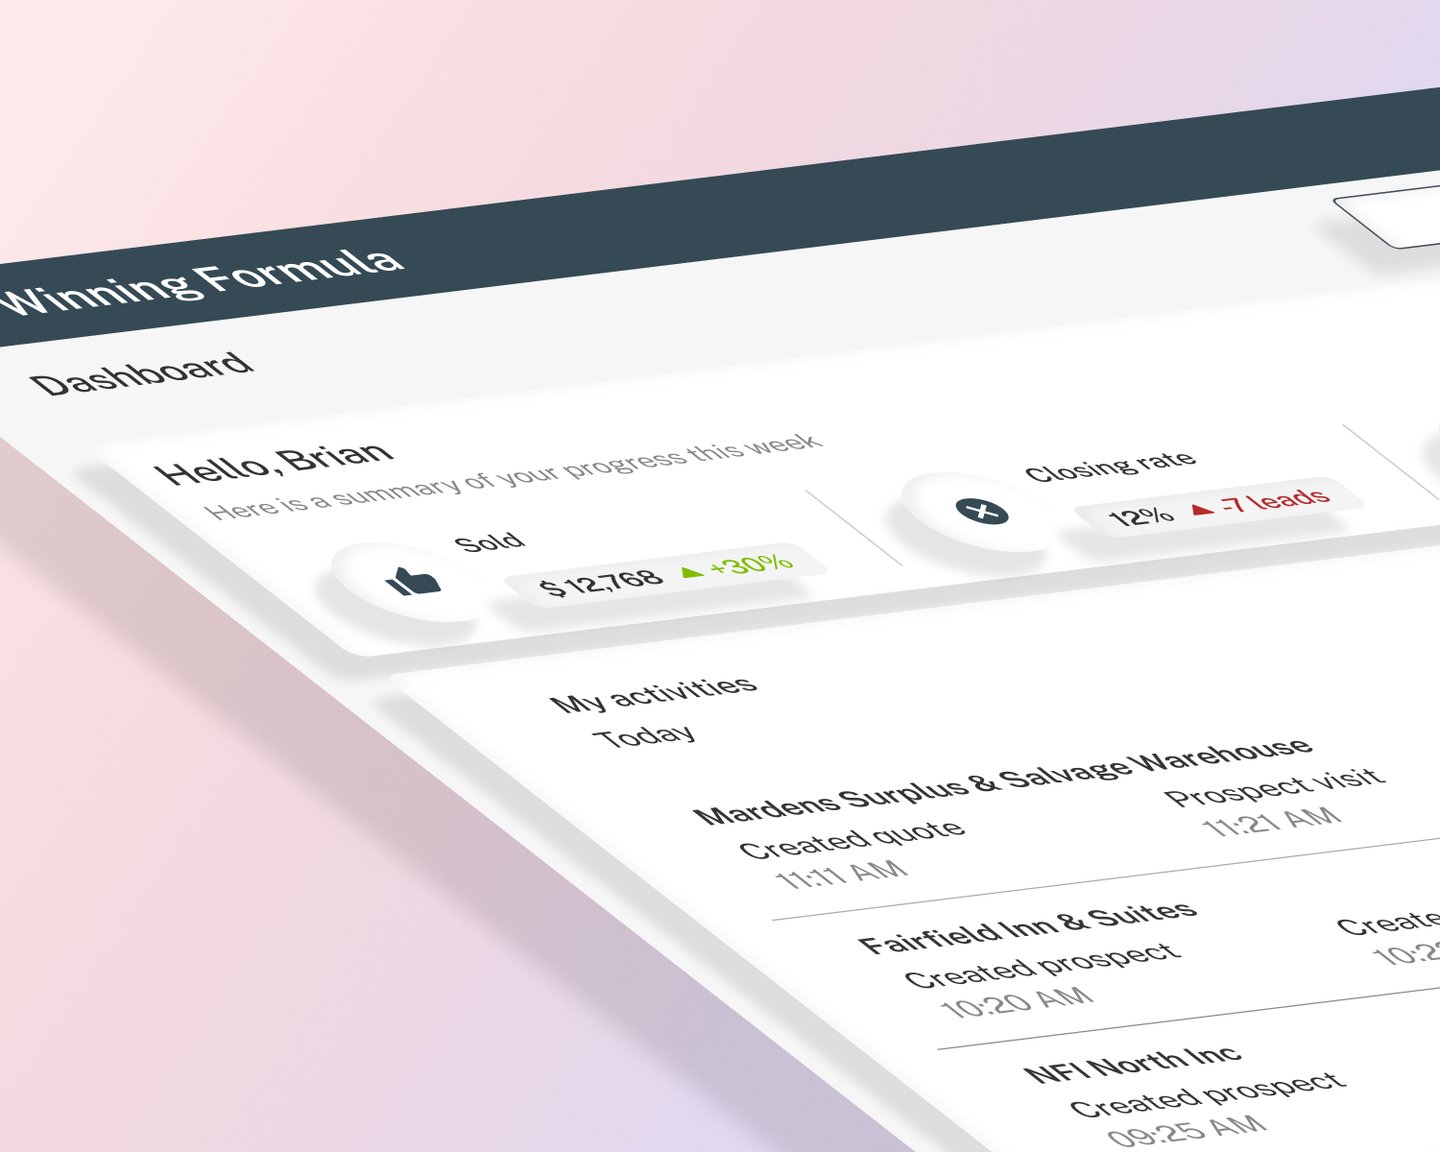
Final design
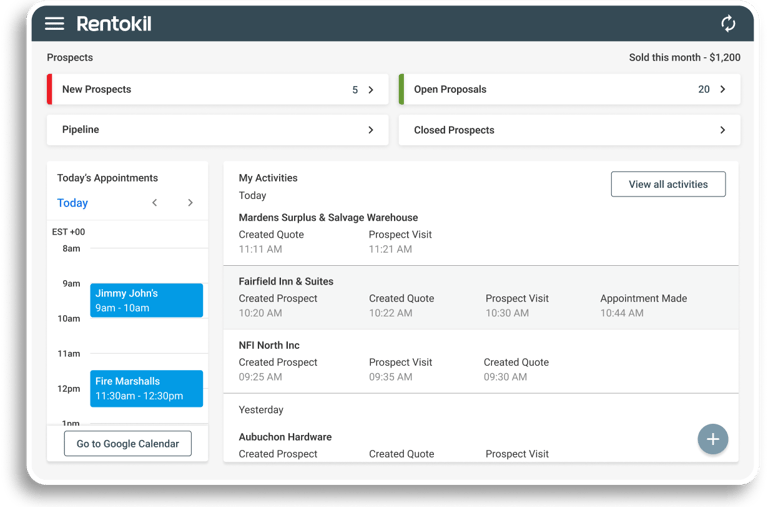
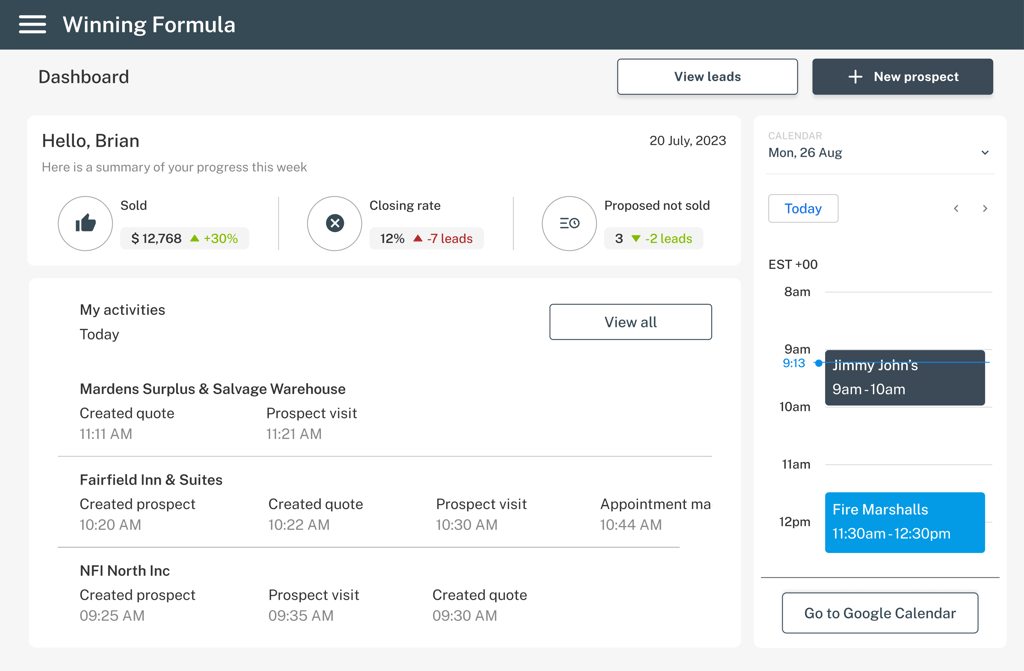
The final design introduced an informational dashboard and simplified data entry, enhancing efficiency and accuracy in the inspection process. This innovative approach not only streamlined operations but also significantly reduced human error, allowing teams to focus on more critical tasks.

Results & impact
The redesign improved usability for field officers and supported more consistent investigation data, leading to enhanced efficiency in their workflow and allowing them to make informed decisions faster. This transformation not only streamlined the data collection process but also encouraged a culture of collaboration among team members, ultimately resulting in improved outcomes in various operations and an overall increase in the effectiveness of the investigations they were handling.
My learnings
Future iterations could include improved offline support and enhanced reporting capabilities, enabling users to access essential features regardless of their internet connectivity. In addition to these enhancements, we foresee the implementation of user-friendly dashboards that will simplify data interpretation and improve overall usability, allowing for a more streamlined experience that caters to a wider audience and meets diverse user needs.